wikipoem
About
An endless slideshow of images from Wikipedia, each shown with its caption. Nothing in it is random: every pair is chosen from the one before by free association. A caption suggests the next picture, a picture finds its next caption, or two images rhyme across unrelated subjects. Walks leave faint trails, so earlier poems shape later ones. It all runs in your browser, with no server doing the thinking.
A good poem has no right answer to train towards. So the work was less about building a model than about how to represent pictures and words, how to choose what comes next, how to teach a system my taste, and how to tell whether any of it was working. Each part below starts with what it does in plain terms; Under the hood has the detail.
Where the pictures come from
Wikipedia articles are full of pictures with short captions written by people, which makes them good raw material: odd, specific, often unintentionally poetic. Google publishes millions of them as a dataset called WIT. I took the English ones, threw out captions that only make sense on their page ("left", "see below", map coordinates), and checked the licence of every image, because the slideshow shows them again.
| Stage | Count |
|---|---|
| Rows of WIT streamed | |
| In English | |
| Captions and licences that pass | |
| Curated core |
Under the hood: streamed from one shard of WIT; captions filtered for length and for positional, editorial and footnote text; licences looked up per file on Wikimedia Commons, keeping only free ones (about a third public domain). Every image is credited beneath it as it's shown, and every caption links to its article. Downloads used the API's thumbnail URLs and a contact User-Agent: 3 failures across 45,200 files.
Turning pictures and words into numbers
A computer can't compare a photo of a seal with the words "harbor seal" directly. CLIP, a neural network OpenAI trained on 400 million pictures and their captions to tell which caption belongs to which picture, makes that possible. It turns any picture, or any piece of text, into a list of 512 numbers, an embedding, such that things that mean similar things get similar lists. Pick a pair:
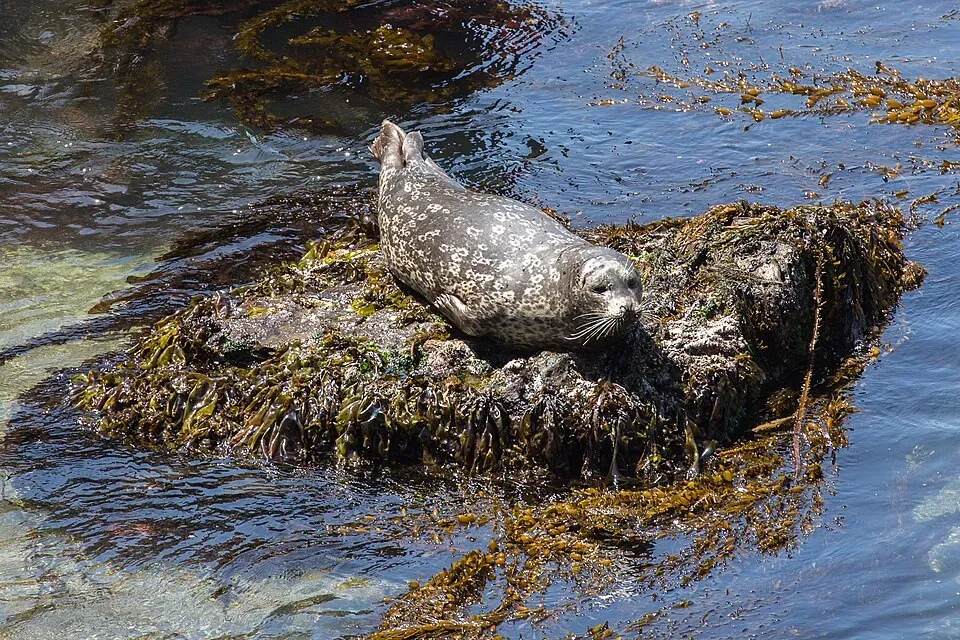
| This image, compared with | Cosine similarity |
|---|---|
| Rock: image | |
| Painting: image | |
| Cake: image | |
| Its own caption | |
| Painting: caption | |
| Cake: caption | |
| Rock: caption |
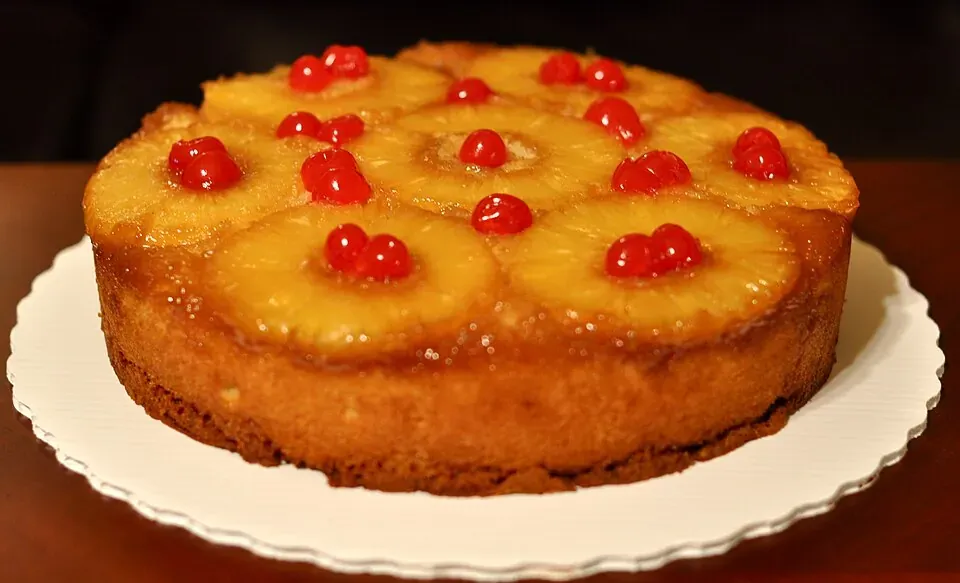
| This image, compared with | Cosine similarity |
|---|---|
| Rock: image | |
| Seal: image | |
| Painting: image | |
| Its own caption | |
| Rock: caption | |
| Painting: caption | |
| Seal: caption |
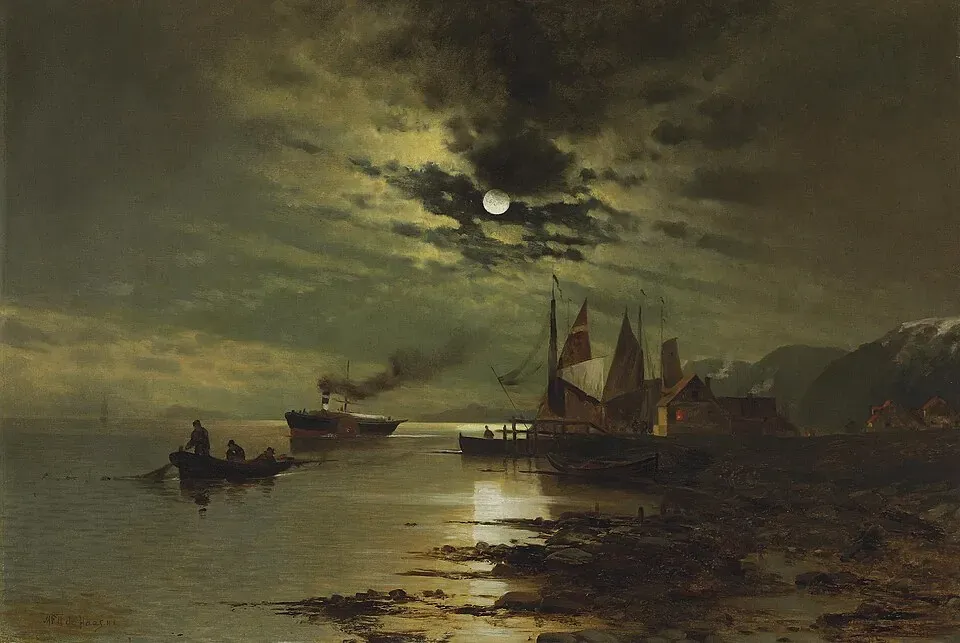
| This image, compared with | Cosine similarity |
|---|---|
| Rock: image | |
| Seal: image | |
| Cake: image | |
| Its own caption | |
| Seal: caption | |
| Cake: caption | |
| Rock: caption |
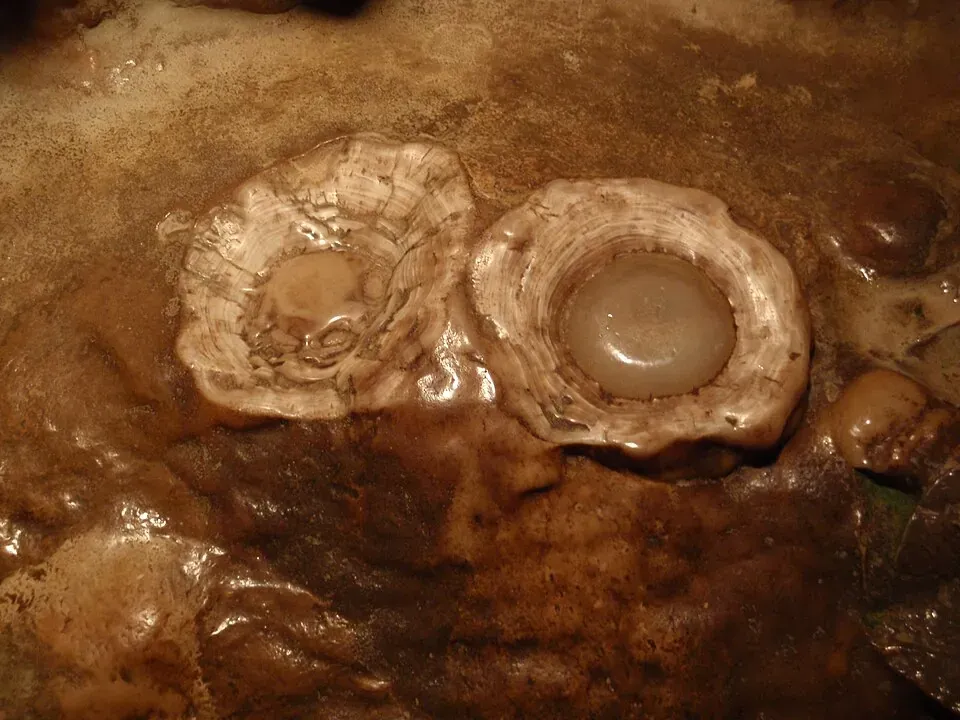
| This image, compared with | Cosine similarity |
|---|---|
| Seal: image | |
| Cake: image | |
| Painting: image | |
| Its own caption | |
| Cake: caption | |
| Seal: caption | |
| Painting: caption |
To compare two lists, you multiply them number by number and add up the results. That gives the cosine similarity: 1 for identical, around 0 for unrelated. And here is the catch: pictures are much more like other pictures than like their own captions.
Image and its own caption
Two random images
Two random captions
Image and a random caption
| Image and its own caption | 0.309 |
|---|---|
| Two random images | 0.409 |
| Two random captions | 0.473 |
| Image and a random caption | 0.147 |
Under the hood: CLIP ViT-B/32, used as is (frozen), with 512-dimensional normalised embeddings. This is the modality gap: an image scores 0.31 with its own caption on average, against 0.41 for two random images. The nearest caption to an image sits at about 0.31, with almost no spread across its top 20 (0.04), while the nearest image sits at 0.82 (spread 0.08). So "pick from the closest few" means something different in each direction, and each kind of step gets its own sampling scale.
Choosing the next pair
Each step can follow a different thread: from the caption to a picture that suits it, from the picture to a caption that suits it, from one picture to a picture that looks like it, or both at once. My first reaction to the simplest version, always the closest match, was "four boat things in a row, four village things, four church things". To a model like CLIP, the closest match is almost always the same subject.
So each step links on one thread and leaps on the others: a step can follow the words while the picture changes completely. On top of that, the walk remembers its recent topics, looks and subjects, and holds back candidates that repeat them. Here is a real walk, made by the slideshow's own code. Turn the memories off and watch it start to repeat itself:
- Loading the corpus…
What each idea does, measured over 300 walks:
| Walk settings (cumulative) | Same-topic rate, consecutive pairs |
|---|---|
| Nearest neighbours | |
| + link on one channel, leap on the others | |
| + more varied neighbour lists | |
| + image-to-image steps | |
| + memory of recent topics | |
| + memory of recent looks | |
| + memory of recent subjects | |
| + stanzas and context (the site) | |
| Two pairs at random |
Under the hood: neighbours are precomputed (top 20 per pair in four modes: text→image, image→text, image→image, and a blend). Re-ranking scores each candidate as z(linking channel) − β·mean z(other channels), β = 0.5. Steps are sampled, not taken: a softmax over scaled similarity, with temperature setting how far down the list a step reaches (mean rank 3.9 of 20 at temperature 0.2, 9.8 at 2.0). Topic, visual-genre and subject-field memories multiply a candidate's weight down, with a fallback to the next mode when everything repeats. Diversity re-ranking of the lists (MMR) barely moved any measure, which is in the table too.
A map of the corpus
Squash all those 512-number lists down to two and you can draw the whole corpus, with alike pairs close together. Walks are meant to cross it:
Loading the corpus…
Under the hood: UMAP (cosine, 30 neighbours) of the normalised sum of each pair's image and caption embeddings, the same "blend" the walk uses as one of its modes. Subjects come from a 22-field taxonomy, labelled by Claude after a pilot of 150 that I checked.
Teaching it my taste
Most of Wikipedia's pictures aren't interesting enough to show. I went through thousands of pairs myself, cutting, keeping or loving them, and used those decisions to train a taste model: a small model that predicts whether I'd cut a pair. It never cuts anything alone. It decides the order I review things in, and it only made cuts where I'd checked that I agreed with it.
| Taste model's predicted chance of a cut | Rescue rate (I kept it) |
|---|---|
| p(cut) above 0.8 | |
| p(cut) 0.5 to 0.8 | |
| p(cut) 0.3 to 0.5 | |
| Second batch, above 0.8 | |
| Second batch, 0.5 to 0.8 | |
| Pairs at random |
Along the way it went wrong in an instructive way. The model was retraining on everything labelled, including the pairs it had cut itself, so it was learning from its own guesses: after one batch, 268 "new" likely cuts appeared. The fix was to train on my decisions only, and check: the clean model agrees with 99.8% of the cuts already made.
Under the hood: logistic regression on the frozen CLIP image and caption embeddings (1,024 numbers per pair), class-balanced. On 5,372 of my labels its cross-validated AUC is 0.91: shown one pair I kept and one I cut, it ranks them right 91% of the time. Uncertainty sampling (reviewing the pairs it was least sure of) surfaced a stricter bar than my first pass, which is why ranking quality, not accuracy at a threshold, was the measure to watch. Every automatic cut is logged with its source.
An AI judge for the captions
A caption can carry a picture or sink it, and there were 20,000 to read. Claude, a large language model (the same kind of AI as ChatGPT), scored each one from 1 to 5 against a written description of what I look for, a rubric. The first rubric agreed with me poorly: it liked captions that explain themselves, and I like short, open lines. So I rewrote it, then tested it fairly, on captions it hadn't seen, scored before I gave my answers.
| Rubric score (Claude) | Share I rated "yes" |
|---|---|
| 1 of 5 | |
| 2 of 5 | |
| 3 of 5 | |
| 4 of 5 | |
| 5 of 5 |
Under the hood: agreement measured as a Spearman rank correlation (1 = it orders captions exactly as I do). Version 1: 0.30 on a first calibration set. Version 2, held out: 0.56, against 0.39 for the simplest baseline, "shorter is better". The same method labelled every pair's subject field. Claude did this work inside the development sessions rather than through an automated pipeline.
What didn't work
A rule to cut every pair with a weak caption would have thrown away 18 of the 34 pairs I'd rescued: strong pictures with plain, technical captions. Picture and caption have to be judged together. And when a stretch of a walk felt samey to me, CLIP rated it as varied as the good stretches. The missing dimension was subject, which CLIP's similarity doesn't capture, so subject fields were added.
Judging the walks
Pairs, transitions and whole walks were rated separately, each as if the others were fine, and each walk ran with settings picked at random and hidden until I'd rated it. Restricting the walk to the curated core, then about 4,300 pairs, raised my average walk rating from 2.73 to 3.78 out of 5, nearly doubled the share of pairs I loved (12% to 23%), and took good-to-bad transitions from 19:18 to 41:25. That's about 20 walks, and the settings changed alongside the corpus, so these are tendencies rather than results.
Shipping it
The slideshow at the top downloads about 5.5 MB once and then runs entirely in the browser: the neighbour lists, a little about each pair, and the walk itself, ported from Python to JavaScript and checked to match it over 300 walks. The pictures come from Cloudflare R2, served by this site.
Under the hood: a 2.2 MB graph (16-bit ids, 8-bit quantised similarities, 8-bit context vectors) plus metadata. Trails are kept in the browser's local storage, keyed by pair id so they survive new versions of the corpus.
How it was built
I directed it: the concept, the curation, every judgement of taste, and the decisions about what to try next. Claude, Anthropic's AI assistant, wrote the code, ran the analyses, and did the caption and subject labelling under rubrics checked against my own judgement. No model was trained end to end; the learning is in the curation, the taste model and the design of the walk. Inspired by Chaski's Wiki Poetics (opens in new tab).